



Shiba Inu Death Cross Confirmed: SHIB Price Faces Major Downside Risks
Shiba Inu confirms a death cross on its daily chart as SHIB falls to $0.00000393 and RSI drops to 27.8. Key support and resistance levels revealed.


Shiba Inu (SHIB), one of the leading memecoins in the cryptocurrency market, is back in the spotlight following the formation of a death cross on its daily chart. According to technical data dated November 15, 2026, the 50-day simple moving average crossed below the 200-day moving average, forming a bearish technical signal. While SHIB was trading at approximately $0.00000393, the Relative Strength Index (RSI) fell to 27.8, highlighting the extent of the selling pressure. With technical indicators continuing to show weakness, investors are now focusing on whether the cryptocurrency can maintain support at $0.00000374.
Death Cross Signal Confirmed on Shiba Inu's Daily Chart
A death cross has formed on Shiba Inu's daily chart as the 50-day simple moving average (SMA 50) moved below the 200-day simple moving average (SMA 200). the SMA 50 stands at approximately $0.00000502, while the SMA 200 is positioned at $0.00000506. The relationship between these two moving averages indicates that the medium-term price trend has weakened relative to the longer-term trend.
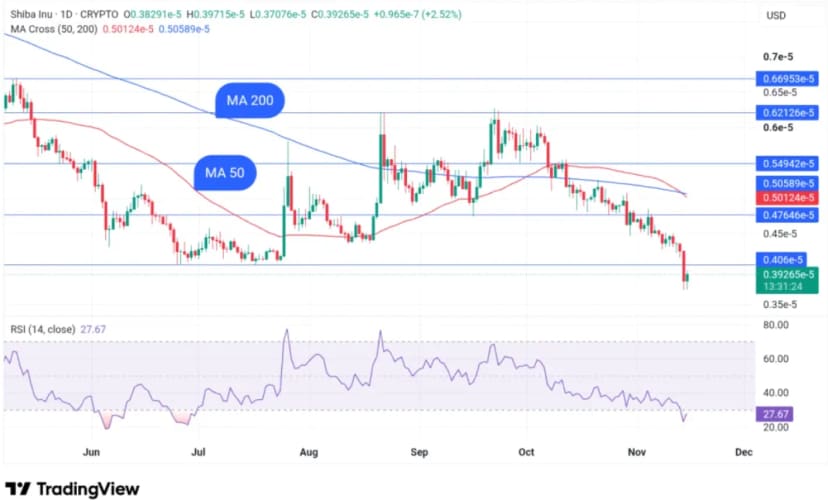
The timing of the crossover is also noteworthy. Technical indicators recorded on November 11 showed that the 50-day moving average was still above the 200-day moving average. However, by November 15, their positions had reversed. This comparison suggests that the death cross occurred within the past several days. The exact date of the crossover may vary depending on the calculation methods used by different data providers.
In early October 2026, SHIB formed a bullish crossover known as a golden cross on its daily chart. At that time, the 50-day moving average crossing above the 200-day moving average raised expectations that bullish momentum could strengthen. However, the price recovery failed to establish a sustainable upward trend, and the technical outlook subsequently deteriorated. Kriptofoni's previous analysis of Shiba Inu's death cross also highlighted weakening price action and trading volume following a similar technical signal.
What Are RSI and MACD Signaling for SHIB?
The death cross formation is accompanied by negative signals from other technical indicators. Shiba Inu's 14-day RSI currently stands at 27.8. An RSI reading below 30 indicates that an asset has entered technically oversold territory. While this reflects strong selling pressure, it also raises the possibility of a short-term relief rally.
Meanwhile, the MACD indicator remains in negative territory. With the daily MACD reading at approximately -0.00000026, downward momentum has yet to show a clear reversal. The Average Directional Index (ADX) has also climbed to 42.3, indicating that the prevailing price trend is strong. Although the ADX does not independently indicate market direction, when combined with negative momentum indicators, it reinforces the strength of the bearish trend.
However, entering oversold territory does not necessarily mean that prices will immediately begin to recover. During prolonged downturns, the RSI can remain below 30 for an extended period. Similarly, a death cross is a lagging indicator based on historical price movements, meaning it may sometimes appear only after a substantial portion of a decline has already occurred. Therefore, investors should not interpret the crossover alone as definitive confirmation of another major selling wave.
Key Support and Resistance Levels for Shiba Inu
For Shiba Inu, $0.00000374 stands out as the first important short-term support level. If the cryptocurrency records daily closes below this level, selling pressure could extend toward the $0.00000354 region. In the event of a deeper correction, $0.00000335 would become the next technical support level to monitor.
On the upside, the first resistance level is located at $0.00000396. If the price breaks above this area, $0.00000407 and subsequently $0.00000422 could come into focus. However, overcoming these resistance levels would not necessarily indicate that the long-term bearish trend has completely ended. For a more convincing technical recovery, SHIB would need to reclaim the $0.00000502–$0.00000506 region, where its 50-day and 200-day moving averages are currently positioned.
Shiba Inu's price performance is not determined by technical indicators alone. Bitcoin's market direction, liquidity conditions across the cryptocurrency market, and investor demand for memecoins also influence its price movements. In an analysis published in September, Kriptofoni reported that the total number of SHIB addresses across Ethereum and Shibarium had reached approximately 1.84 million. Nevertheless, growth in the number of addresses should not be interpreted as a direct indication of future price increases.
Kriptofoni's Assessment
The formation of a death cross on Shiba Inu's daily chart indicates that the positive technical outlook observed in October was not sustained. The renewed bearish crossover between the short-term and long-term moving averages suggests that sellers have gained greater control over the medium-term market trend. Meanwhile, the RSI falling into oversold territory demonstrates that the technical picture is not limited to downside risks, as short-term relief rallies also remain possible.
For SHIB, maintaining support at $0.00000374 could be the first important development signaling a slowdown in selling pressure. Conversely, losing this support level could increase the risk of further declines toward $0.00000354 and $0.00000335. On the upside, the cryptocurrency would need to break above $0.00000396 and establish sustained momentum beyond higher resistance levels.
Because a death cross is calculated using historical price movements, it cannot predict future market direction with certainty. For Shiba Inu to experience a sustained technical recovery, buying demand would need to strengthen, selling pressure would have to ease, and key moving averages would need to be reclaimed. Although current data indicates that the bearish trend remains strong, oversold conditions suggest that significant short-term price volatility could continue.
Spotted an error? Let us know · Our editorial standards
Disclaimer: This content is for informational purposes only and is not investment advice. Cryptocurrencies are high-risk; make investment decisions based on your own research.
Content Editor and Writer
Dr. Mesut İnan is a researcher, academic and crypto journalist who has been producing content about cryptocurrencies since 2018. He brings a different perspective to the industry by combining his expertise in sociology with the cryptocurrency ecosystem. Before joining Kriptofoni as co-founder, content editor and writer, İnan worked for several cryptocurrency media platforms: he was an editor and writer at Kriptokoin from 2018 to 2023 and at COINTURK from 2023 to 2024. İnan made a valuable contribution to the ecosystem with his book on Bitcoin, "Bitcoin Sen Bizim Her Şeyimizsin" (Bitcoin, You Are Our Everything). Alongside his academic background, his regular analyses, news and commentary have made him one of the well-known names in cryptocurrency journalism in Turkey. İnan continues his work as a writer and educator and remains a prominent expert voice in the cryptocurrency field.
All articles